Time Series and sampled Variables

Click on the map above to view a table of WGZE/WGPME
time series and their sampled variable categories.
The link above will take you to a page that summarizes the variable types sampled by the ~150 time series stations associated with WGZE and WGPME members and associates. A "variables-sampled table" similar to below is provided for each entry. A legend describing each variable code (e.g. hdoxy = disssolved oxygen, ztotc = total copepods) is provide farther below. Colored-in table cells indicate that that variable is regularly sampled by that time series. Gray/uncolored background indicate that that variable was not sampled (or that data from that variable were not available to WGZE).
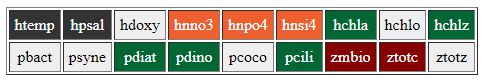
Hydrographic Variables (black cell coloration):
- htemp = tempeerature
- hpsal = salinity
- hdoxy = dissolved oxygen
Nutrient Variables (orange cell coloration):
-hnno3 = nitrate
-hnp04 = phosphate
-hnsi4 = silicate
Phytoplankton Variables (dark green cell coloration):
- hchla = chlorophyll-a
- hchlo = fluorometric or other chlorophyll type
- hchlz = CPR "Phytoplankton Colour Index (PCI)"
- pbact = Total Bacteria abundance
-psyne = Total Synechococcus abundance
- pdiat = Total Diatom abundance
- pdino = Total Dinoflagellate abundance
- pcoco = Total Coccolithophore abundance
- pcili = Total Ciliate abundance
Zooplankton Variables (dark red coloration):
- zmbio = Total "Biomass" measurements (e.g., total sample wet mass, dry mass, or displacement volume)
- ztotc = Total Copepod abundance
-ztotz = Total Zooplanton abundance
2026-07-01
|